
Shrinking Populations (and Economies)
Populations in many first-world countries are aging and in some cases shrinking, which has drastic implications for industry, security, and national competitiveness. There is a demographic revolution underway that is different than anything we have ever seen before. This is no longer an academic discussion. Demographics is a catalyst that is driving a fundamental restructuring of economic activity, manifested in changing buying and consumption patterns, social support structures, and habitation and transportation requirements.
The world’s population has been growing since the end of the Black Death in the mid-14th century. Overpopulation has been a fear since Malthus essentially created the field of modern demographics in the late 18th century. Paul Erlich famously popularized the risks of overpopulation in his 1968 bestseller The Population Bomb, where he predicted mass starvation due to overpopulation.
Fortunately, the human race has generally managed to sustain growth to this point due to advances in agricultural, sanitation, and medical technology. We currently have around 7.4 billion people inhabiting this earth, but the forward-looking trends are dramatically different than expected. The total world population is still growing at a rate of 1.1%, which represents around half the rate of the late 1960s, but the divergence in population trajectories between developed and developing nations is staggering. Overpopulation is still a very real issue in some areas — but we now must consider the effects of underpopulation.
The United Nations estimates that 48 countries will decline in population between 2015-2050. This is somewhat optimistic, given that 83 countries had below-replacement level fertility rates during 2010-2015. Declining population is not a normal state of affairs, with brief periods of war, famine, or epidemic being exceptions. Europe is shrinking, as European nations have more deaths than new births. The replacement fertility rate is generally cited as 2.1 children per woman of childbearing age. Europe as a whole had a fertility rate of 1.6 from 2010-2015, which is projected to grow to 1.8 by the 2045-2050 period. Today, 24% of the population of Europe is over the age of 60, the largest ratio in the world.
To cite the obvious, lower birth rates over time result in fewer people. This is interesting math to consider. During the 2010-2015 period, 25 countries had fertility rates below 1.5. The Austrian think tank IIASA published a paper in 2008 that extrapolated that if the global fertility rate shrank to 1.5, near the rate Europe is at now, the world population would shrink by half in 2200, and fall to 1 billion by 2300. This is not a scenario that experts consider to be likely, but it is interesting nonetheless.
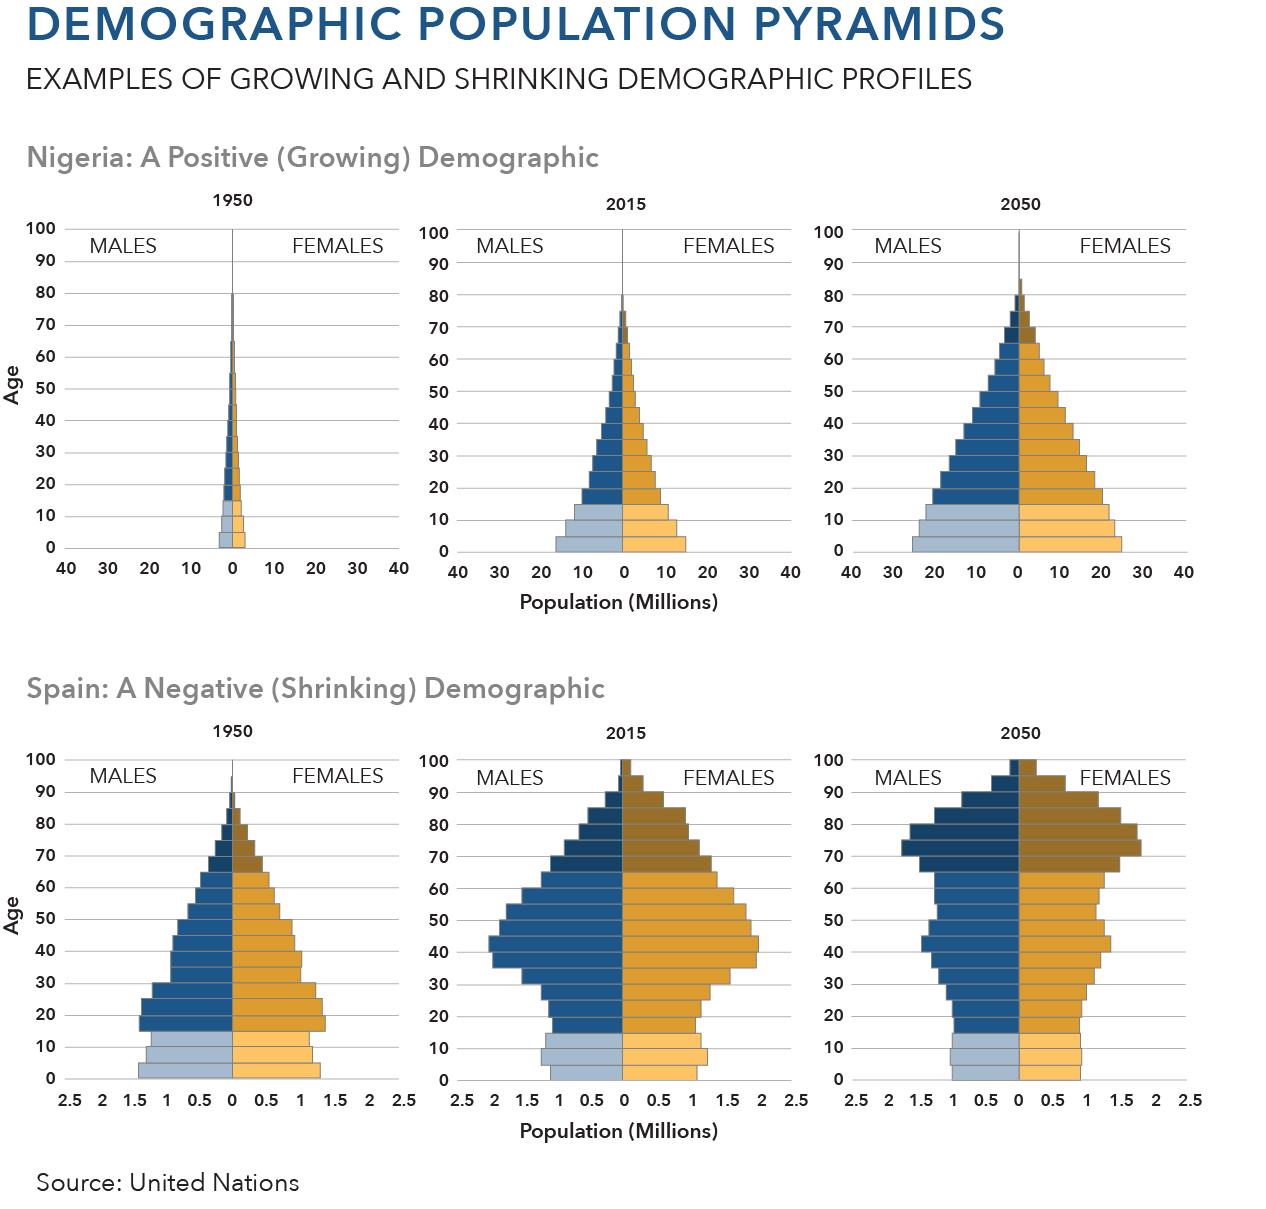
A lower birth rate also changes the ratio of young people to old people, workers to retirees, and increases the average age of a nation. When we talk about the demographic bulge, we are referring to the charts below that depict snapshots of populations by age bands over time.
This is very meaningful for the countries that are affected, as well as their trade partners. It is important that we not dismiss demographic decline as an interesting trend that will lead to more space for everyone left. Societies are built upon assumptions of certain ratios of contributors vs. consumers of their tax base. Companies are also built upon assumptions that their customers will have certain requirements and preferences in the aggregate. As these assumptions change, the structures that are built on top of them also necessarily must change.
Looking globally, we see that demographic decline is not a universal phenomenon. Many countries are growing, some very quickly. Most of the global population increase is anticipated to come from a relatively short list of countries, many of which are in Africa. Around half of the total global increase is projected to come from just 9 countries: India, Nigeria, Pakistan, Democratic Republic of the Congo, Ethiopia, United Republic of Tanzania, United States of America, Indonesia, and Uganda, which are listed in order of the size of their contribution to the total population growth.
Total Fertility by Country 2010-2015
Source: United Nations, Department of Economic and Social Affairs, Population Division (2015). World Population Prospects: The 2015 Revision, DVD Edition.
The general split between growing populations in developing countries and shrinking populations in developed countries is noteworthy, and allows us to draw some general conclusions about the reasons for this phenomena. It is also interesting to note that the United States is an outlier, in that it is a developed economy with a generally positive demographic profile.

Causes for the Decline
There is a lot of speculation around why these countries are shrinking. It is likely that this trend is a result of a number of factors as opposed to a single issue, such as the changing cost/benefit profile of children, decreasing religious affiliation, and increasing longevity due to medical and agricultural technology.
An obvious issue is that for developed economies higher up the value chain, children are expensive. Children in agrarian societies provide an economic benefit by working in the fields. Children in information-age societies are cost centers. Speaking as an American and a parent, my children will be a financial drain until they move out and college tuition is paid for. At no point do I expect my children to contribute to the family financially, which is a change from much of human history. There are obviously non-financial reasons for having children, but understanding the underlying economic realities provides an important foundation.
The increasing secularization of developed economies also seems to play a role. Without trying to extrapolate causality, religious people tend to have more children. According to a study produced by the Pew Research Center, individuals with no religious affiliation had a fertility rate in 2010-2015 of 1.7, compared with 2.7 for Christians, 3.1 for Muslims, and 2.5 for the global average.
Fertility Rate by Religion, 2010-2015
| Religious Affiliation | Fertility Rate |
|---|---|
| Buddhist | 1.6 |
| Unaffiliated | 1.7 |
| Jewish | 2.3 |
| Hindu | 2.4 |
| World Average | 2.5 |
| Christian | 2.7 |
| Muslim | 3.1 |
Source: Pew Research Center, The Future of World Religions: Population Growth Projections, 2010-2050.
People are also living longer as a result of advances in medical and agricultural technology and processes. Longer average lifespans do not correlate directly to having fewer children, but they do directly impact the average age and ratio of old to young in societies. Older people are also a cost for their children in many cases, and may indirectly contribute to the financial component of the decision to have children.
National and Economic Competitiveness
Demographics matters to everyone. Some categories of business and public organizations will be impacted more directly than others, but the impact of changing demographics has a material effect on hiring, marketing, selling, building, governing, transporting, insuring — the list goes on. We will focus on five primary areas of impact here: economic growth, government finances, consumption, transportation, and habitation.
Declines in population result in fewer workers, which in general reduces economic productivity. Economic productivity is not purely a function of labor and includes efficiency, technology, and capital, but as a rule fewer workers results in reduced productivity. Countries with shrinking labor pools should anticipate lower growth rates. As economic strength measured by GDP growth is viewed as an element of national competitiveness, shrinking labor pools have a detrimental effect on national competitiveness.
A reduction in workers also has a negative impact on the tax base, as fewer workers contribute less tax revenue. This issue is specifically dangerous when the number of retirees supported by tax revenues remains flat or increases, while the number of workers decreases. The United Nations uses a metric called the Potential Support Ratio (PSR), which is the ratio of people aged 20-64 to those age 65 and older. In 1950, when the global median age was 23, the global PSR was around 12. In 2015 the global age has increased to around 30, and the PSR has reduced to 8. It is anticipated to be around 4 in 2050.
Again, the divergence within countries is dramatic. The average PSR for Africa is 12.9, Asia is 8, Latin America and the Caribbean is 7.6, Oceania is 4.8, while Europe and North America is around 4. Japan has the lowest PSR in the world, at 2.1 workers per retiree. Seven European countries have PSRs below 3. The UN projects that by 2050 7 countries in Asia, 24 in Europe, and 4 in Latin America and the Caribbean will have a PSR below 2.
Potential Support Ratio for Select Countries, 1950-2100
Source: United Nations, Department of Economic and Social Affairs, Population Division (2015). World Population Prospects: The 2015 Revision, DVD Edition.
Simply put, these ratios are extremely important to the financial strength and in some cases the solvency of nations. If the demographic decline continues as projected, countries will have to completely rework their retirement age and social support policies for retirees. This will also create challenges for businesses in the form of labor scarcity and shrinking markets for products and services.
Demographics will also change the shape, consumption patterns, and service requirements of consumer markets as the average age of people buying goods and services increases. One’s age and family requirements influence what they buy. This is meaningful both from a style and requirements perspective, forcing companies to understand and adapt to both. The stylistic changes are easiest for companies to address. More difficult will be when entire product categories shrink because there are fewer people to buy them.
Age and family composition also change living preferences, impacting the size of houses and mixes of house vs. apartment living and urban vs. suburban living. This will take time to manifest into changes in asset prices, but will ultimately be important for both homebuilders and those who own housing inventory.
Transportation requirements and consumer purchasing preferences will be affected by demographics. These effects range from decreasing demand for large-family vehicles, to the preference for third-party, elderly-friendly transportation services. In addition to public transportation, other general city and public amenity requirements will also likely be impacted by older populations.
The examples listed above are the tip of the iceberg. Every industry and public institution will feel the effect of the demographics catalyst in some fashion. The speed and scope of change varies according to the demographic profile of each country and region, but the impact is global. Companies who operate from countries with favorable demographics, like the United States, need to understand this catalyst as they sell into international markets and are impacted by macroeconomic forces.
Join the Catalyst Monitor
Join our community, where we push out regular insights to help maintain situational awareness on technological and socioeconomic trends.