The Artifacts of Globalization
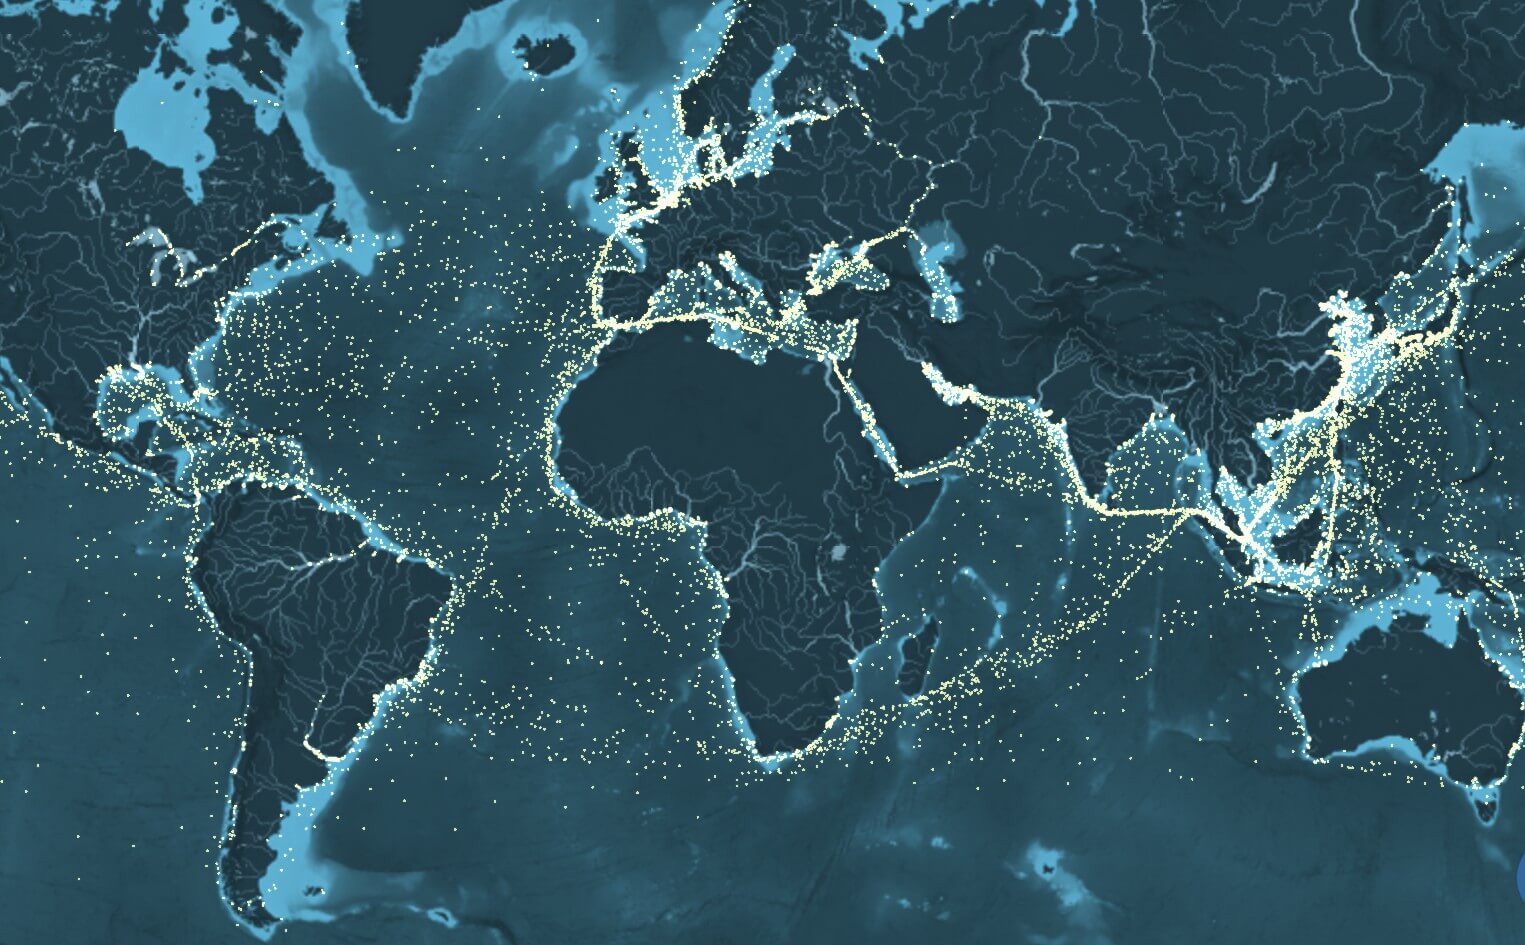
This interactive map depicts movements of the global merchant fleet over the course of 2012 overlaid on a bathymetric map, the undersea equivalent of a topographic map. The statistics depict the maximum freight carried by represented vessels by type and a CO2 emissions counter, measured in thousand tons.
This map effectively represents global trade, which is the primary artifact of globalization. As around 90% of world trade is carried by the international shipping industry, these shipping routs are the arteries that support the global economy. Key maritime routes and high-volume ports can be clearly identified. Seven of the top ten ports by volume are in China, with the remaining three being Rotterdam (Netherlands), Busan (South Korea), and Singapore.
Strategic maritime choke points also become apparent. The Strait of Malacca, for example, between Malaysia and the Indonesian island of Sumatra, carries approximately 25% of all the world’s traded goods. The Strait of Hormuz, between Iran and the United Arab Emirates, carries approximately 20% of the world’s petroleum, which represents 35% of all petroleum traded by sea. Other important choke points to note are the Panama Canal that connects the Atlantic and Pacific Oceans, the Bab-el-Mandeb passage from the Arabian Sea to the Red Sea, the Suez Canal that connects the Red Sea and the Mediterranean Sea, the Bosphorus which connects the Black Sea with the Sea of Marmara through to the Mediterranean Sea, and the Strait of Gibraltar that connects the Mediterranean Sea with the Atlantic Ocean.
Thanks to the interactive studio Kiln for building this tool, and to the UCL Energy Institute for providing the data.
Join the Catalyst Monitor
Join our community, where we push out regular insights to help maintain situational awareness on technological and socioeconomic trends.


